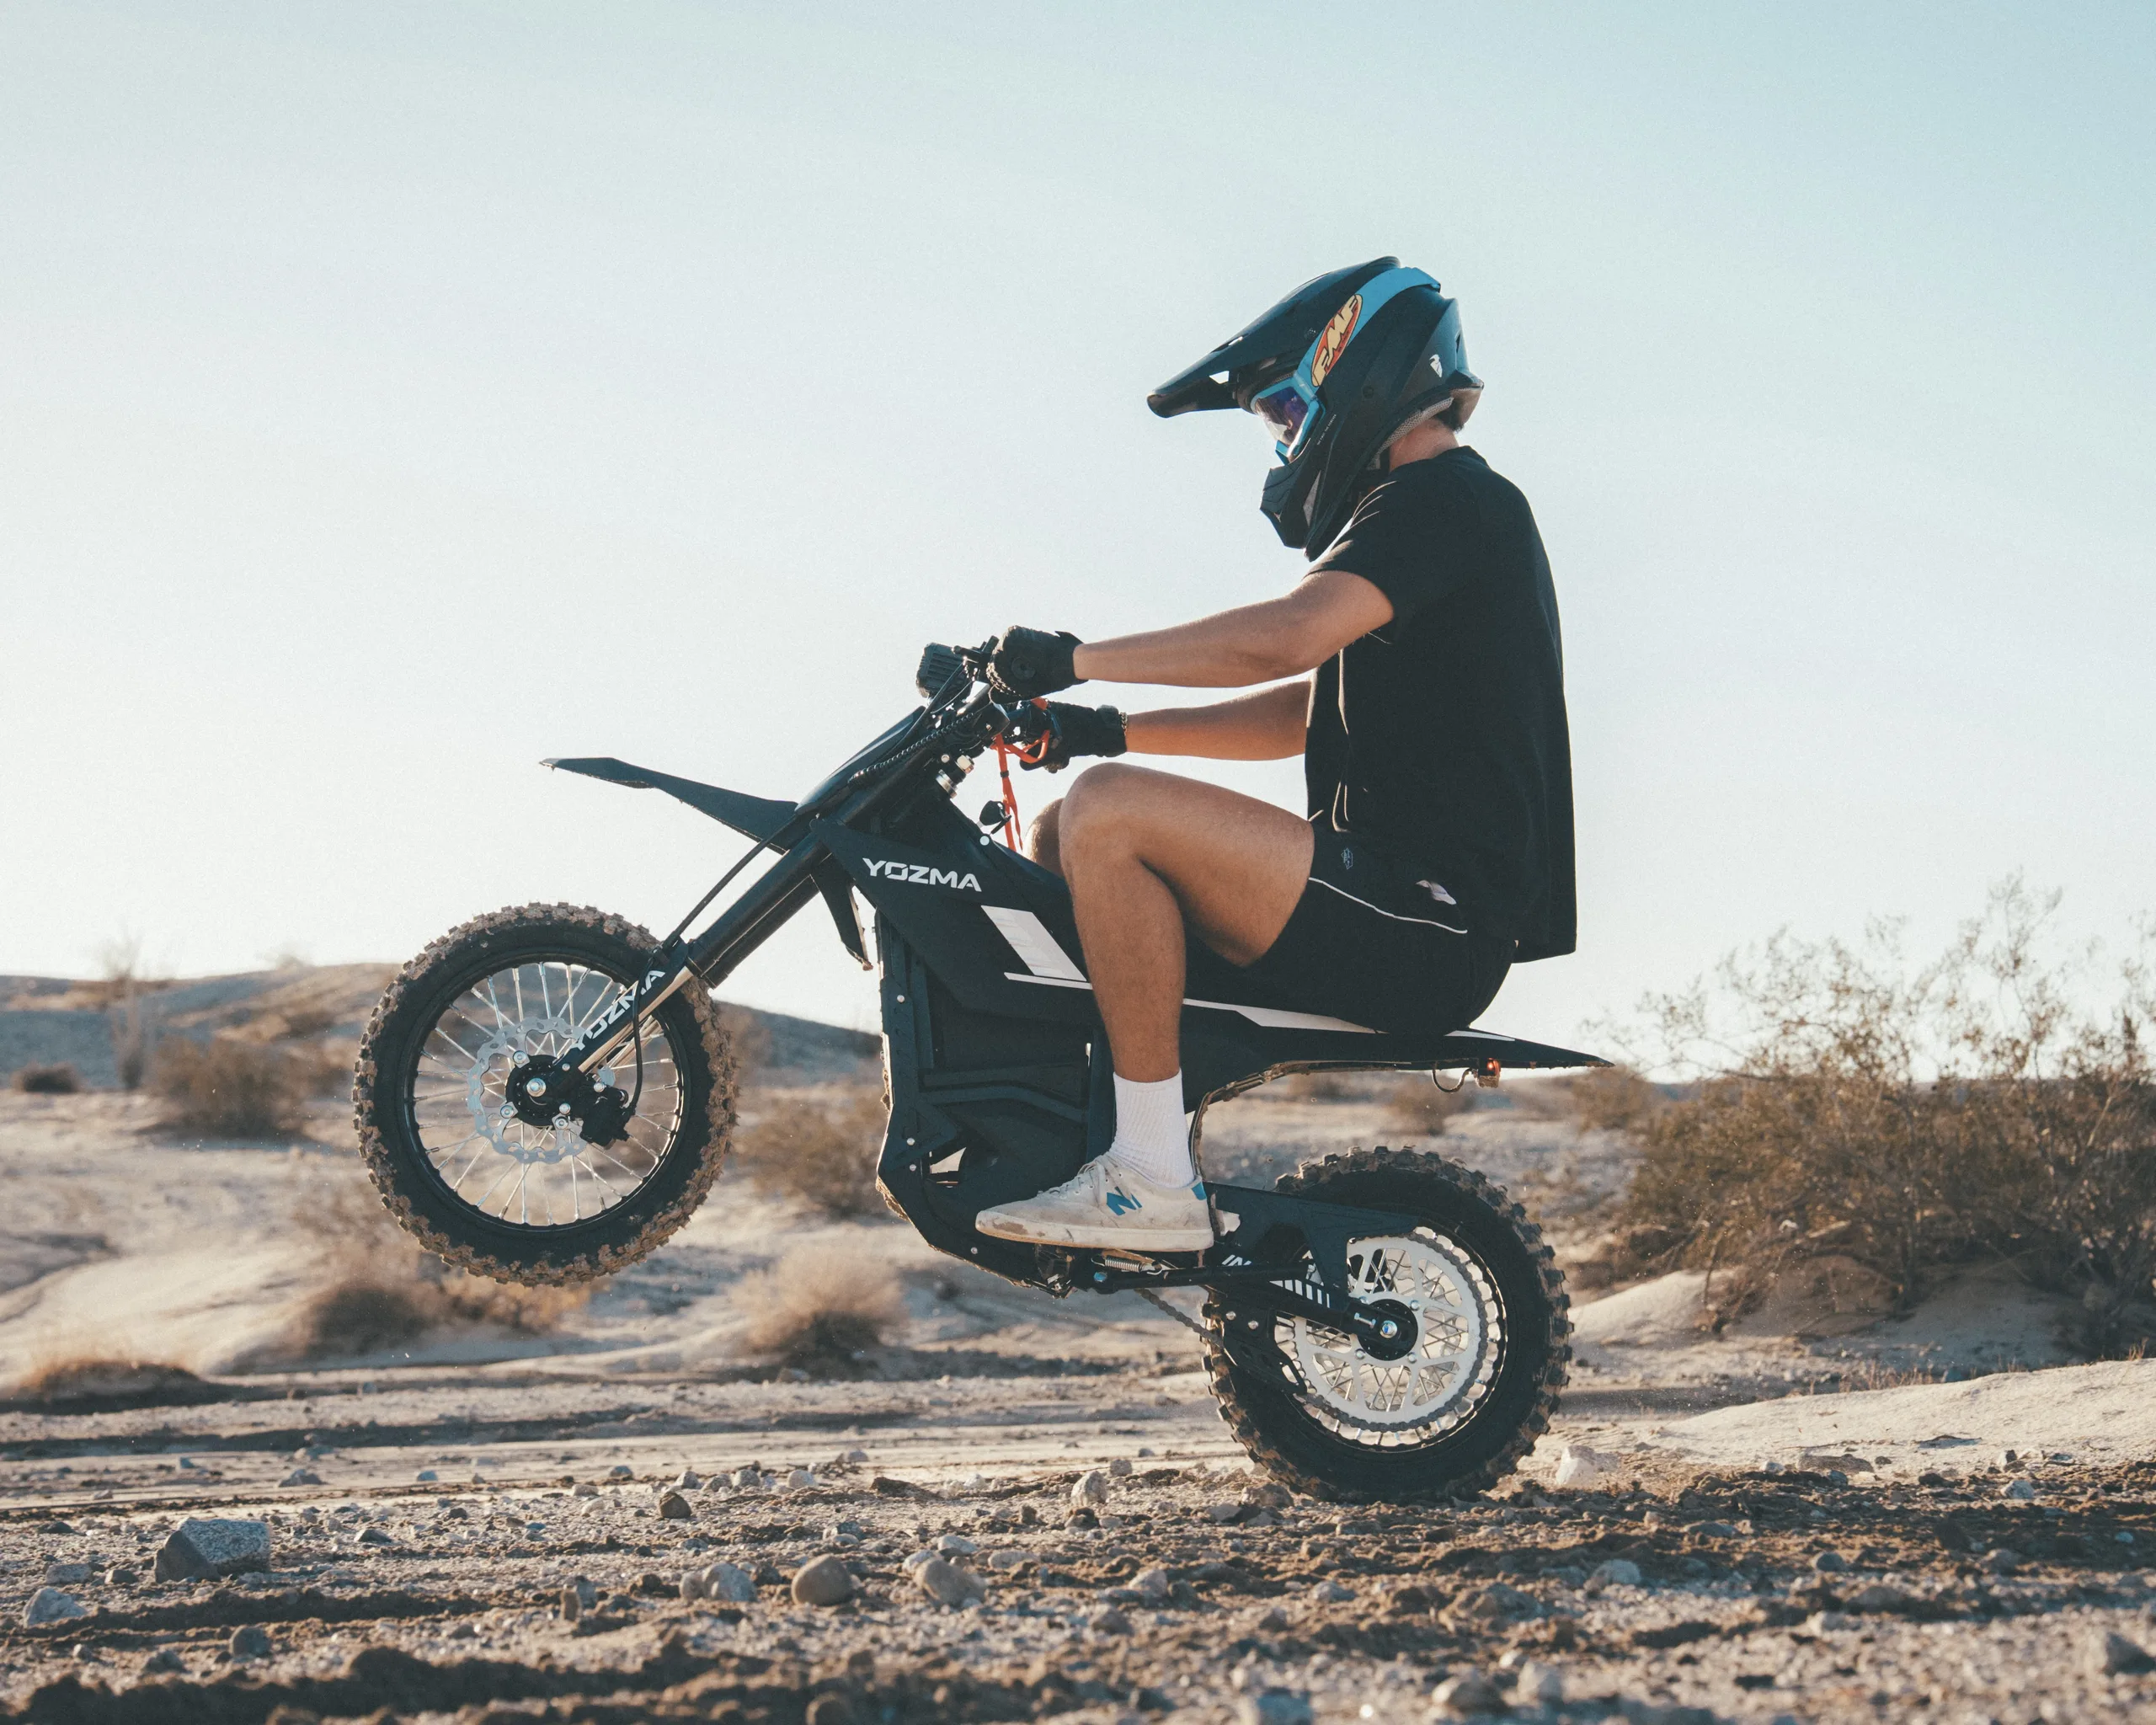
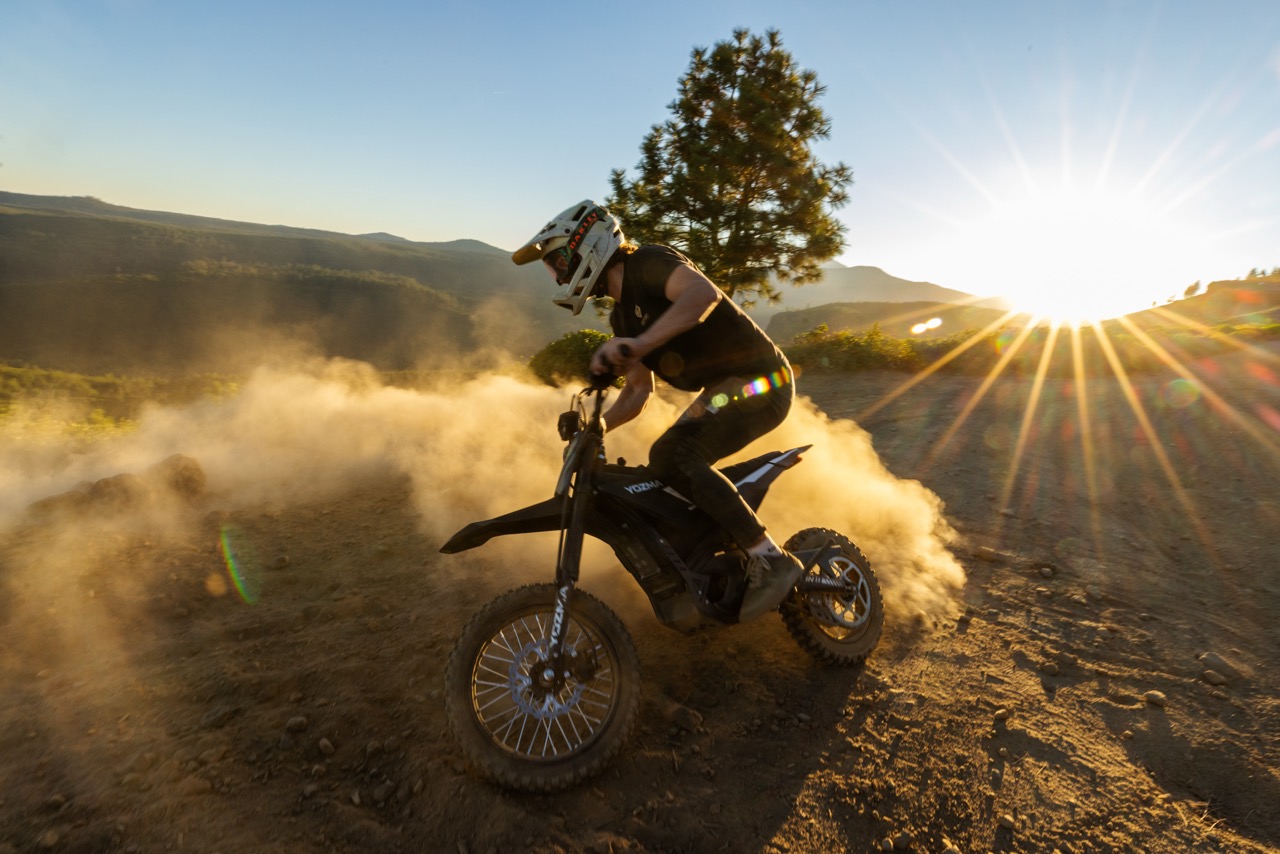
Yozma releases new off-road electric dirt bike with reverse gear and 88 km of range
Yozma has launched the all-new IN 11 electric dirt bike globally. The IN 11 is an off-road as well as city-friendly dirt bike, featuring a mid-drive motor and a large 1,404 Wh lithium battery. Plus, it offers a top speed of 45 mph (72 km/h) and a range of 55 miles (88 km) on a single charge.
Yozma has unveiled its latest electric dirt bike, the IN 11. It comes as a direct successor to the last year’s IN 10, bringing significant upgrades in terms of power, battery capacity, and suspension. Speaking more precisely, the IN 11 is now more powerful than before. It features a mid-drive motor, providing 200 Nm of torque and a 4,800 W peak power, a step up from the 2,600 W of the IN 10. The powerful motor delivers a maximum of 45 mph (72 km/h) of top speed.
As for the battery, the electric dirt bike boasts a large 1,404 Wh lithium battery, which is said to offer 55 miles (88 km) of range on a single charge. However, the real-life range of the e-bike depends on riders’ throttle use, elevation, terrain, and riding speed. On top of that, there are also four power modes, including eco, sport, race, and stunt. Like the premium Talaria Komodo, the affordable IN 11 dirt bike ships with one-button reverse gear.
The LCD display shows essential driving-related information such as speed, distance, modes, and battery levels. Furthermore, it supports a maximum payload of 220 lbs (100 kg), down from the 265 lbs (120 kg) limit of its predecessor, the IN 10. The high carbon steel frame paired with 14” front and 12” rear tires. Stopping power comes from dual hydraulic disc brakes. Plus, it has hydraulic front suspension and a nitrogen-charged rear absorber.
The IN 11 comes with an IPX6 rating, meaning it can withstand water jets from any direction, although it is not rated for immersion in water. Other features include a high-visibility brake light, a one-touch wheelie, a magnetic emergency switch, and auto wheelie assist. It’s worth noting that the dirt bike is designed for riders between 3.94 ft (120 cm) and 5.9 ft (180 cm) tall.
As for price, the Yozma IN 11 is priced at $1,499. Available in a black colorway, buyers can now purchase the electric dirt bike directly from Yozma’s official website.
But we of course, don’t live in a vacuum, and others, including the Heybike Villain and the Engwe Eagle have already brought 52V, 4.5kW motors to the pit bike form factor, sometimes at much lower cost.
I should say here that parents who want to keep their kids’ e-motos in the 20-30mph range are going to be a whole lot happier with the 2.6kW than 4.5kW motors. Two nice safety improvements over the original Yozma IN10 include the magnetic kill switch and brake lights on the IN11.
Electrek’s take: Yozma’s advantages...If we are keeping it real here, there are dozens of similar-sized and spec’d mini-e-motos out there, often at a much lower cost than the Yozma IN11. But I’d argue that as the biggest and most trusted of these brands, Yozma is a safer bet.
Also, the IN11 is just a lot more solid than the random Amazon/Alibaba electric pit bike. Putting the IN11 together is quicker and easier than any other emoto I’ve built, and it just feels a lot more solid.
That feeling extends to the safety features. The brakes are more dialed in. The turning feels a lot tighter, and the overall ride is quieter and lighter. I believe, and my limited testing bears this out, that spec for spec, I got a lot more range on the IN11 than I got on other bikes with similar battery and motor specs. That 200nm of torque feels like it belongs on a much more expensive e-moto.
The wheelie mode is a nice trick (15, 25, or 40 degrees wheelie settings) and something we’ve only seen on Anylands for this price point so far. It is more developed on the IN11 but expect to see this on just about every new pit bike coming out over the next few years.
That said, the price, which is currently fluctuating between $1299 and $1499 (don’t forget your $60 off Electrek code), Yozma is going to be on the more expensive side of the 4.5kW emotos out there and some of the newcomers are bringing an intense value competition to the place where Yozma once dominated by itself.
Yozma IN 11 spec sheet:
4,800W: Peak motor output, up sharply from the prior IN 10’s 2,600W baseline.
45 mph: Advertised top speed in Race mode. Real world only slightly lower
52V 27Ah = 1404Wh: Removable lithium battery pack, promising up to 55 miles of range in Eco mode with a 5- to 6-hour recharge time. No one has time to drive for 55 miles in Eco Mode. Expect 20-30 miles when gunning it.
~$1,299: Pre-order and promotional launch pricing. Yozma has the swag to demand a higher price point than the sub-$1,000 off-brand offerings, but it isn’t a slam-dunk decision.
Auto Wheelie Assist: Embedded in “Stunt Mode,” this feature allows riders to cap front-wheel elevation between 15° and 40° with anti-tip protection, functioning like digital training wheels for lofting the bike. Wheelies also increase the likelihood of injuries obviously
One-button reverse gear – helps riders maneuver tight trails and tight garage spaces without manhandling the frame.
Brake Light / Magnetic kill switch – nice safety features and substitute for key in some cases.
Tiered riding modes: Four maps (Eco, Sport, Race, Stunt) let users toggle between commuter battery conservation and full-torque delivery.
by: Autonews
MOTO GP
Jorge Martín avoids surgery and may compete in Malaysia next week
Spaniard Jorge Martín, who fractured his right radius yesterday following a crash in the Sprint race at the Australian Grand Prix—held at the Phillip Island Circuit—will not require surgery and intends to attempt to compete in the Malaysian Grand Prix next weekend.
The Aprilia rider underwent a CT scan following his crash in yesterday’s Phillip Island Sprint. Only a non-displaced fracture of the distal radius has been confirmed, while the ulna — which had raised some doubts — has not suffered any fractures.
In light of the latest tests, the possibility of surgery has been definitively ruled out and Martín will not have to return to Spain. His plans have not changed: he will fly from Australia to Malaysia, where he will undergo the treatment recommended by doctors.
However, it is still too early to know whether Jorge will be able to consider trying to race at Sepang. The next few days will be crucial in finding out. The fact that the fracture to the radius is non-displaced and close to the wrist is a positive aspect, offering at least some hope.
The decision to go to Malaysia was made because Martín will be able to undergo the same treatment there as he could have received in Spain. It also leaves the door open to trying to race next week. However, as we said, it is too early to know at this stage.
Early this morning in Spain, as delays and cancellations unfolded at Phillip Island—eventually leading to the total cancellation of the Grand Prix—Aprilia provided an update on the condition of the Madrid-born rider, who had undergone a CT scan to assess a potential fracture of the distal end of his right ulna.
In a statement, Aprilia clarified that the only confirmed injury was the previously identified non-displaced fracture of the distal radius. The team also announced that Martín will not return to Spain, but will instead undergo the necessary treatment over the coming days.
These details suggest that Martín’s goal is to secure medical clearance next Thursday at the Sepang International Circuit to compete in the Malaysian Grand Prix. He heads into that event trailing Marc Márquez—who took the lead in the overall standings following his Sprint victory—by just ten points.
Regarding this, Paolo Bonora expressed optimism: "We will monitor the situation day by day, but, honestly, he seemed to be doing well this morning, which is very positive for us," the Aprilia Racing team manager told MotoGP, noting that the rider's participation in Sepang will depend on medical evaluations.
"We will certainly work toward that. He is the first one pushing to reach this goal, but we have to wait for medical updates. We are engineers, after all, so we must follow the medical assessments and his physical condition. But we are quite optimistic about it," he emphasized. Massimo Rivola was far more pessimistic. "Very difficult. Very, very difficult," the Aprilia Racing CEO replied during the press conference. "I hope to see Jorge with us in Sepang," he continued, highlighting Martín’s run of bad luck at Aprilia and his own desire to bring the relationship between the two parties to a close in the best possible way.
by Autonews
AUTONEWS
Buying winter tires? These performed the best, while 15 models failed the test
So, you're ready to buy some winter tires for your car. Congratulations! Winter tires have unique attributes which mitigate the risks of snow, ice, and falling temperatures on the road, providing motorists with greater control behind the wheel. In contrast to all-weather tires, winter tires are specially made for winter conditions.
Now that you've decided to move forward, let's conduct a bit of research. When investing in a set of winter tires, for example, you must put them on all four-wheel positions of your car. It will maximize the handling of the vehicle and mitigate the risk of losing traction on either the rear or front axle when driving on slippery roads. Do not mix summer tires and winter tires on passenger cars.
Here are some more useful things to consider before you choose a new set of winter tires.
1. Tread pattern...Winter tires have a dedicated tread pattern to provide superior traction and safety on snowy, wet, and icy roads. The rotation of the wheel will push the snow into the broader grooves and generate additional traction. The tread also features sipes – tiny little slots – that provide additional traction by enabling the tread blocks to flex and add additional grip edges for improved snow, ice, or wet performance.
There are legal requirements for minimum tread depth that vary by region, particularly during winter conditions. Drivers should always verify the specific regulations that apply in their area. Maintaining sufficient tread depth is essential for ensuring traction, handling, and overall safety on winter roads.
2. Tire compound...Finally, the tire compound is tailored for winter performance and has a higher percentage of natural rubber, so it remains soft and flexible in cold temperatures. If the tire compound isn't designed to perform in winter conditions – as is the case in a summer tire – it will go hard and brittle. That, in turn, leads to a substantial decline in traction, grip and safety.
3. Winter tire size and pressure...When buying a new set of winter tires for your vehicle, be sure to check the size specifications as provided by the vehicle manufacturer. These details can be found in the owner's handbook, the door frame on the driver's side, or under the fuel cap. You can also find the correct tire sizes in the CoC document (Certificate of Conformity).
To keep things simpler, using the same tire size as the original equipment (OE) tires is the best course of action.
For winter tires, the recommended tire pressure in PSI or bar is the same as for summer tires. Again, you can consult the owner's handbook, the driver's side door frame, or under the fuel cap for this information. It’s impossible to avoid fluctuations in tire pressure; for every drop in 10 degrees in air temperature, the tires will drop one PSI (0,1 Bar).
While you can’t avoid fluctuations, it is recommended to compensate for the temperature drop with +0.2 bar for winter tires in the winter period to prevent the air pressure getting too low in cold temperatures.
The important thing is to monitor your tire pressure every two to four weeks and top it up as necessary. Driving with under-inflated tires impacts fuel economy and tread wear, compromises safety, and could even lead to a puncture.
The German automobile club ADAC tested 32 winter tire models for the 2026/2027 season, and the results reveal significant differences in quality and safety. Only six models received a "good" rating, while experts advise against 15 of the tested tires. The results for tires designed for smaller cars are particularly concerning, as a large number of these models showed serious flaws.
The best results were achieved by the Continental WinterContact TS 870 and Pirelli Cinturato Winter 3 tires, both receiving a score of 2.2. As reported by N1 BiH, the testing showed that these models can bring a car traveling at 80 kilometers per hour to a stop in approximately 35 meters on wet road surfaces.
How were the winter tires tested? ADAC published the results on September 22, 2026, with the testing covering two tire sizes.
For small cars, models with the dimensions 185/65 R15 were tested, while tires with the dimensions 225/50 R17 were evaluated for mid-range vehicles. 16 models were tested in each category.
The tires were evaluated under various driving conditions—on dry and wet asphalt, as well as on snow and ice. Part of the snow testing was conducted in the Finnish town of Ivalo. In addition to safety, the final rating also takes into account projected mileage, tire wear, and efficiency.
It is important to note that with ADAC, a lower score is better. Scores ranging from 1.5 to 2.5 indicate a good result, while scores from 4.6 to 5.5 are considered unsatisfactory.
Which winter tires are best for small cars? In the category of tires with the dimensions 185/65 R15, only two out of the 16 models tested received a "good" rating.
The best result was achieved by the Continental WinterContact TS 870, with a score of 2.2. Experts particularly praised the tire's performance on wet roads, its braking characteristics, and its resistance to aquaplaning—the loss of contact with the road surface due to a layer of water.
In second place was the Michelin Alpin 7, with a score of 2.5. This model demonstrated good safety characteristics on various surfaces, though it showed minor shortcomings in handling on snow.
Five models received a "satisfactory" rating.
Among them are:
-Optimo Winter Touring OW41 – score 3.2
-Goodyear UltraGrip Performance 3 – score 3.3
-GT Radial WinterPro2 Evo – score 3.5
Interestingly, the Goodyear UltraGrip Performance 3 achieved a significantly better result in a larger size.
These winter tires are not recommended by experts...In the category of tires for small cars, ADAC does not recommend nine out of the 16 models tested. Six models received a rating of "sufficient," while three were rated as "insufficient" due to serious shortcomings in driving safety.
Among the lowest-rated tires were:
-Sunny Winter-max NW611
-Atlas Polarbear HP
-Rockblade Rock 868S
Testing also revealed significant differences in durability....The estimated average mileage for tires designed for small cars is around 31,000 kilometers, whereas the least durable models are expected to last only about 22,000 kilometers. According to ADAC, these results suggest that manufacturers do not devote equal attention to all sizes of winter tires.
Which tires are best for mid-range cars? In the 225/50 R17 size category, the results were somewhat better. Four models received a rating of "good," while six were rated as "insufficient."
The best results were achieved by the Pirelli Cinturato Winter 3, which performed exceptionally well on wet roads. This model offered the shortest braking distance, excellent resistance to aquaplaning, and precise handling.
Both the Pirelli Cinturato Winter 3 and the Continental WinterContact TS 870 can bring a car to a stop from a speed of 80 kilometers per hour in approximately 35 meters.
Goodyear stood out for its high projected mileage, while Michelin demonstrated the best performance on snow and ice.
The average projected mileage for tires of this size exceeds 45,000 kilometers.
What did other tests reveal? The results from ADAC largely align with other European winter tire tests.
The British magazine *Auto Express* tested 11 models in the 205/55 R16 size.
The Continental WinterContact TS 870 achieved the best result, scoring 100 percent according to the test's methodology. It was followed by the Pirelli Cinturato Winter 3 with 99.8 percent and the Hankook Winter i*cept RS3 with 99.4 percent.
The German automobile club AvD tested tires in the 225/45 R17 size. In this test, the Pirelli Cinturato Winter 3 performed slightly better than the Michelin Alpin 7, with Goodyear, Continental, and Bridgestone following behind.
When should winter tires be replaced? ADAC recommends replacing winter tires when the tread depth falls below four millimeters or when the tires reach eight years of age. Below the recommended tread depth, a tire’s grip on snow and wet road surfaces is significantly reduced, which can increase stopping distances and the risk of a traffic accident.
For drivers who cover high mileage, experts advise paying attention to the expected durability of the tires, in addition to their safety characteristics.
Test results show that when buying winter tires, one should not look solely at the price or a well-known brand name, but rather at the performance of the specific model in the appropriate size.
To choose the right winter tires, look for the Three-Peak Mountain Snowflake (3PMSF) symbol on the sidewall, verify the correct tire size from your vehicle manual, and match the tire type to your local winter climate.
1. Check for the 3PMSF Symbol:
• 3PMSF (Three-Peak Mountain Snowflake): Always look for this mountain and snowflake icon stamped on the tire sidewall. It proves the tire meets official industry standards for severe snow traction.
• Avoid M+S Alone: The "M+S" (Mud and Snow) rating is common on standard all-season tires, but it does not mean the tire is tested or certified for true winter or ice performance.
2. Match the tire type to your climate:
• Dedicated Winter Tires: Made with a specialized soft rubber compound that stays flexible in temperatures below 7°C (40°F) and features deep sipes (tiny zig-zag cuts) for biting into ice and snow. Best for regions with heavy snow, slush, and freezing roads.
• All-Weather Tires: A hybrid option featuring the 3PMSF symbol that can stay on your vehicle year-round. Good for moderate winter climates where you want better grip than standard all-seasons without seasonal swaps.
• All-Season Tires: Designed for warmer weather and temperatures above 4°C (40°F); they harden in the cold and lose critical traction on ice and snow.
3. find your exact size:
• Check your current tire sidewall, your vehicle's door placard, or your owner's manual to find the exact dimensions (for example: 225/45R17).
• Size components: This code tells you the tire's width, aspect ratio (sidewall height), construction type, and wheel diameter.
• Minus-sizing option: Some drivers buy slightly narrower winter tires or drop down a wheel size (e.g., from 19" to 17") with taller sidewalls to cut through deep snow better and save money on rims.
4. Install a full set of four:
• Always install winter tires on all four wheels—never just two (whether front, rear, or all-wheel drive).
• Mixing tire types or using only two winter tires creates dangerous handling imbalances, leading to loss of control, spinning out, or severe understeering.
Popular & trusted brands:
• Premium Picks: Michelin (such as the X-Ice SNOW+), Bridgestone (Blizzak), and Pirelli (P Zero Winter 2).
• Value / Budget Picks: General (AltiMAX Arctic 12) and Vredestein (Wintrac Pro+).
• You can read detailed reviews and check options via Tire Rack or explore product advice from Michelin and Continental Tires
I need your help to continue with this work (QR code above)
sábado, 24 de outubro de 2026
AUTONEWS
Chinese car banned from sale after losing its rear axle
Malaysia’s Road Transport Department—known as *Jabatan Pengangkutan Jalan* (JPJ), which is tasked with ensuring that no vehicle available to the public poses a safety risk—has suspended the sales authorization for a model from the Chinese manufacturer Chery, following incidents in which the entire rear axle—including the suspension and wheels—detached from the vehicle. The model in question is the Omoda 5.
Chery is a manufacturer majority-controlled by the Chinese government, and Omoda is one of several brands under which it markets its vehicles—including in Malaysia and Portugal, albeit in slightly different configurations. After the JPJ announced the sales ban, Chery remained silent, even as images of Omoda 5 vehicles missing their rear axles—with some left stranded on the roadside—circulated widely on social media.
Recall...Chery Auto is recalling 8,878 Omoda 5 SUVs in Malaysia over potentially defective rear axle welds, after an axle detached from a vehicle while it was being driven, prompting the local regulator to suspend new registrations of the model.
The incident involved a 2023 Omoda 5 in Malaysia and caused no injuries, Chery said in a statement on Sunday.
The company said it immediately launched an investigation and has been in close contact with regulators, including Malaysia's Road Transport Department (JPJ).
The investigation found that some welds on the rear axle trailing arms of vehicles in the affected batch may lack sufficient strength, creating a risk of weld rupture under extreme conditions. Chery said models using this design had already been discontinued.
Chery's Malaysian subsidiary has launched a recall in coordination with JPJ to inspect the components and replace them free of charge where necessary.
Chery also said it had launched precautionary checks on Omoda 5 vehicles from the same production batch in China and other relevant markets. The company said it would disclose the findings promptly.
A Chery Omoda 5 experienced a rear wheel detachment while driving in Malaysia on October 6. Image from Weibo.
An Omoda 5 lost its rear axle and wheels while being driven in Johor Bahru, in the Malaysian state of Johor, on October 6, raising concerns about the model's safety, according to local media reports.
JPJ announced on October 11 that it was immediately suspending the Omoda 5's Vehicle Type Approval (VTA) and new registrations until a technical investigation is completed and the safety risks are confirmed to have been adequately addressed.
JPJ instructed Chery Malaysia to identify all potentially affected vehicles using part numbers, production batches and vehicle identification numbers (VINs). The agency will also conduct technical audits of the Omoda 5's production and assembly line and rear axle component supplier.
Chery Malaysia said the recall covers the C and H variants of the Omoda 5, but did not specify the production years of the affected vehicles.
The company stressed that the recall does not affect models currently on sale. The Omoda 5 has been discontinued in Malaysia and was replaced by the Chery O5 in September 2025. The older Omoda 5 used a torsion beam rear suspension, while the O5 uses a multi-link independent rear suspension.
This is the Omoda 5's second recall in Malaysia over rear axle problems. In April 2024, an Omoda 5's rear axle suddenly detached while the vehicle was being driven, prompting Chery to recall 600 vehicles for inspection.
The investigation at the time attributed the problem to improperly calibrated rear axle welding equipment. It ultimately identified 60 vehicles produced on August 15, 2023, that required rear axle replacement. Chery Malaysia has yet to say whether the latest incident involves the same defect.
The Omoda 5 went on sale in China in 2022, but sales were weak, with monthly volumes failing to exceed 1,000 vehicles from 2023 onward. It was subsequently withdrawn from the domestic market and is now primarily sold overseas.
Chery established Omoda in 2021 as an overseas brand targeting young consumers globally. Together with Jaecoo, launched in 2022, it forms the O&J brands. The 2 brands announced in April this year that their combined cumulative global sales had surpassed 1 million vehicles.
Chery is considering bringing Omoda and Jaecoo to China to bolster its domestic sales, which remain under pressure, Chinese technology news outlet Leiphone reported last month.
Overseas markets are the main driver of Chery's growth. Chery Group sold 292,308 vehicles in September, up 4.2% from a year earlier, according to data compiled by CnEVPost. Exports accounted for 207,814 vehicles, setting a monthly record for a Chinese automaker.
According to local media, the Chinese manufacturer responded six days later, urging all Omoda 5 owners to visit an authorized service center to have their vehicles inspected and determine whether they are among the affected units. Chery further stated that the vehicles already identified as having a manufacturing defect are those equipped with semi-rigid (torsion-beam) rear axles. However, this clarification is unlikely to alleviate concerns among owners of versions equipped with a multilink rear suspension. China Observer recounts the events in detail (see the video below)
Interestingly, Chery’s issues with rear axles did not just begin; back in 2024, the JPJ was informed that a defect similar to the current one was affecting 600 Omoda 5 units. At that time, Chery issued a voluntary recall, bringing all affected vehicles into the workshop—unlike what has happened now.
In October 2026, Malaysia temporarily suspended sales and the registration of new models of the Chinese SUV, the Chery Omoda 5, following an incident in which the rear axle and wheels detached from the vehicle while it was in motion.
Key details:
• Vehicle involved: Chery Omoda 5 (versions C and H).
• The issue: A structural failure in the welds of the rear axle arms (torsion beam rear suspension), which can break and cause the wheel assembly to detach from the vehicle.
• Government action: The JPJ (Jabatan Pengangkutan Jalan / Road Transport Department of Malaysia) suspended the vehicle’s type approval, halting new sales and registrations until its safety can be verified.
• The recall: Chery has issued a recall for 8,878 units of the model in the country for inspection and component replacement.
• Background: A similar issue occurred previously in Malaysia in 2024, affecting approximately 600 units at that time.
APRILIA
APRILIA RS 660 | Phillip Island Tribute
The Aprilia RS 660 Phillip Island Tribute pays homage to the enduring connection between Aprilia Racing and Phillip Island, one of the most iconic circuits in Grand Prix motorcycle racing. Aprilia has claimed ten victories at the circuit across different classes, alongside further success in the Superbike World Championship with the RSV4. In 2025, Raúl Fernández’s MotoGP victory aboard the RS-GP marked an even greater milestone: Aprilia’s 300th Grand Prix win, cementing its position as the most successful European manufacturer in the history of the World Championship.
To celebrate its long history of success at the Australian circuit, Aprilia has created a special edition of the RS 660, one of the most popular and best-selling middleweight sportbikes on the market.
The Aprilia RS 660 Phillip Island Tribute stands out with an exclusive livery inspired by the colours of the Australian circuit: a white base, green accents on the side fairings and tail section, and red wheels. The side fairings feature the Phillip Island logo, incorporating the circuit layout, the “Phillip Island circuit” lettering and a chequered flag marking the finish line.
A shield-shaped badge on the fuel tank commemorates Aprilia’s ten victories at the circuit, while each bike’s unique serial number is displayed on the top yoke. A passenger seat cover completes the standard equipment.
The Aprilia RS 660 Phillip Island Tribute was created to celebrate a legacy of victories and unforgettable moments at the Australian circuit, a place that holds a special place in Aprilia’s history.
Aprilia Racing’s history of racing successes is closely linked to Phillip Island. On the blisteringly fast and spectacular Australian circuit, Aprilia Racing has secured no fewer than ten victories across the various classes of the MotoGP World Championship, not to mention those achieved in the Superbike World Championship with the legendary RSV4. The MotoGP victory secured on the same circuit in 2025 by rider Raúl Fernández on the RS-GP enabled Aprilia to reach the historic milestone of 300 wins in the World Motorcycle Championship, making it the most successful European manufacturer in the history of this event.
To celebrate its unbreakable bond with the Australian circuit – which, from 2027, after almost thirty seasons, will no longer feature on the MotoGP calendar – Aprilia has produced a special edition of the RS 660, one of the most popular and best-selling mid-range sports bikes on the market.
The Aprilia RS 660 Phillip Island Tribute is a limited edition model, and features a striking livery designed exclusively for this model, as well as a passenger seat cover included as standard equipment. The side panels feature the circuit’s logo, formed by the track layout, just above the words ‘Phillip Island Circuit’ and the chequered flag at the finish line.
The base colour is white and, together with the green on the sides and tail section and the red of the wheel rims, it echoes the colours featured in the circuit’s logo. The fuel tank features a badge showing the number of victories Aprilia has achieved on this circuit, whilst the serial number is on the steering head plate.
The technical platform is that of the RS 660, the mid-range sports bike that serves as a benchmark in its class, and which has redefined sportiness in an innovative and modern way: as a lightweight, high-performance machine with superior technical and electronic features, it is also accessible and enjoyable for everyday use by new riders, whilst simultaneously delivering a thrilling riding experience on the track for experienced riders. It is the only motorcycle to offer such an advanced suite of electronic controls: the latest-generation aPRC system includes traction control, wheelie control, engine braking control, cornering ABS and engine mapping managed by the Ride-by-Wire electronic throttle control, all of which are adjustable to meet the rider’s needs on the track and make road journeys safe and enjoyable. The electronic features are completed by launch control, a bidirectional electronic gearbox and cruise control system. Also fitted as standard is the six-axis inertial platform, which enables the controls to operate at their best.
The 660 cc, four-valve, front-mounted twin-cylinder engine – a compact and lightweight latest-generation model – achieves record performance for a twin-cylinder engine of this capacity, delivering 105 HP at 10,400 rpm and 70 Nm of torque at 8,400 rpm (although a version with power limited to 35 kW is also available). The engine is utilised as a load-bearing element and helps to create a compact, lightweight and rigid structure, thanks to a frame comprising two side beams bolted in place at the steering head and at the rear, continuing Aprilia’s tradition of crafting superb chassis architectures.
The 660 cc forward-facing parallel-twin engine, featuring four valves per cylinder, is a compact and lightweight, next-generation unit that delivers outstanding performance for a twin-cylinder engine of its displacement, producing 105 hp at 10,400 rpm and 70 Nm of torque at 8,400 rpm. A restricted 35 kW version is also available.
The Aprilia RS 660 Phillip Island Tribute shares the same technical foundations as the RS 660, a motorcycle that has redefined modern sport riding through an innovative combination of lightweight construction, performance and advanced technology and electronics. Accessible and enjoyable for everyday riding, even for newer motorcyclists, it is equally capable of delivering exhilarating thrills on the track in the hands of experienced riders.
This balance between everyday rideability and sports performance meets the exclusive character of a numbered special edition in the Aprilia RS 660 Phillip Island Tribute.
by: Autonews
MOTO GP
Marc Márquez nears a tenth world title at Phillip Island
Spaniard Marc Márquez won the Sprint race at Phillip Island—a venue that serves as the stage for the Australian Grand Prix—leading a Ducati 1-2-3 finish ahead of his brother, Álex Márquez, and Italian rider Fabio Di Giannantonio. With this result, Márquez has taken the lead in the 2026 MotoGP standings, following a crash by fellow Spaniard Jorge Martín, who had to be stretchered off the track.
The battle for the win was defined by a duel between the top two riders in the championship, with the lead changing hands multiple times until Martín crashed on the eighth of 13 laps while running in second place.
How the Australian GP qualifying session unfolded: The day began with overcast skies and a wet track for the pole-position battle at Phillip Island. As MotoGP activities got underway, the air temperature was 16°C, with the track surface at 21°C; winds were blowing at 7 km/h, and relative humidity stood at 86% as the starting grid began to take shape.
There were some changes to the rider lineup this weekend at Pramac and Gresini. Following Toprak Razgatlıoğlu’s withdrawal from the remainder of the season due to a shoulder injury, Yamaha test rider Augusto Fernández was brought in to compete in the Australian round. Meanwhile, at Gresini, Fermín Aldeguer also sat out the event, with Iker Lecuona called in as his replacement.
Additionally, Luca Marini was sidelined for Honda on Friday after contracting a virus and developing a fever. The Italian rider was declared unfit to continue for the rest of the Australian GP weekend.
All riders opted for soft rain tires for the 30-minute Free Practice 2 (FP2) session. Even before any lap times were recorded, Pecco Bagnaia’s GP26 encountered issues out on the track. Marc Márquez took the early lead with a time of 1:40.524, followed by Jack Miller, Jorge Martín, Iker Lecuona, and Fabio Di Giannantonio.
Marc Márquez remained in the lead for the first ten minutes of the session, improving his pace significantly to 1:38.676. The Spaniard opened up a one-second gap over Marco Bezzecchi, who sat in second place. Further down the order, Diogo Moreira held the 11th position.
After the final round of pit stops, rain began to fall again at Phillip Island, hindering the riders' last-ditch efforts during the FP2 session. Even so, Marc Márquez lowered his time to 1min37s112 and finished the session in the lead, 0.8 seconds ahead of Pedro Acosta, who took second place. Martín, Bezzecchi, and Zarco rounded out the top five, with Moreira in 10th place.
The Aprilia rider, who arrived in Australia with a two-point lead over Márquez, lost control of his bike at turn eight—after riding over the kerb at the previous corner—and was subsequently transported to the circuit’s medical center.
Medical examinations revealed a fracture of the radius and a suspected fracture at the distal end of the ulna, near the wrist; consequently, Martín has been declared unfit to compete in Sunday’s main race.
Márquez, who started from pole position, maintained the lead at the start, while Martín moved up from fourth to second and quickly joined the fight for the front.
The Aprilia rider managed to take the lead, but an error on the fifth lap allowed his rival to reclaim the top spot. The back-and-forth overtaking continued until the crash that forced Martín out of the race.
Marc Márquez made an excellent start to defend his pole position, while Jorge Martín moved past both Álex Márquez and Johann Zarco—the latter having previously overtaken the Gresini rider. Álex Márquez fought back early in the second lap, with Pedro Acosta also in the mix in fifth place.
Álex Márquez launched an attack on Martín, who responded a few corners later by challenging Marc; however, Marc ran wide, and the Ducati rider successfully defended his lead. On his second attempt, he successfully overtook Martín, while Acosta passed Álex after getting past Zarco. Further back, Pecco Bagnaia retired from the race.
Martín and Marc began to pull away from the rest of the field, with Álex returning the favor to Acosta, while Zarco retired due to a mechanical issue. On the fifth lap, Martín made a mistake—managing to avoid a crash—but Márquez seized the opportunity to take the lead.
In the following corner, Martín challenged again, but Marc defended his position well. This allowed Álex to close the gap, leaving behind Acosta, who began to struggle and conceded fourth place to Fabio Di Giannantonio, with Marco Bezzecchi also lurking nearby.
Jorge Martín attempted to overtake Marc Márquez several times, but the Ducati rider held his line firmly and managed to protect his lead. With five laps remaining, Martín lost control of his Aprilia and crashed at Turn 8, requiring him to be taken off the track on a stretcher. Shortly after, Raúl Fernández also retired from the race.
From that point on, Marc Márquez simply withstood the pressure from Álex Márquez to secure the victory, while Fabio Di Giannantonio defended his podium spot against Marco Bezzecchi. Pedro Acosta finished fifth, followed by Brad Binder and Jack Miller, with Diogo Moreira edging out Iker Lecuona to claim the final point.
In the closing laps, Álex Márquez and Di Giannantonio drew closer to the winner, but they could not prevent an all-Ducati podium.
Bezzecchi recovered from 12th place at the end of the first lap to finish fourth, 1.074 seconds behind, ahead of Spaniard Pedro Acosta (KTM) in fifth, 3.689 seconds back. Japanese rider Ai Ogura (Aprilia) crossed the finish line in sixth place but received an eight-second penalty for a tire pressure infringement, dropping him to 13th.
The sanction promoted South African Brad Binder (KTM) to sixth, Australian Jack Miller (Yamaha) to seventh, Brazilian Diogo Moreira (Honda) to eighth, and Spaniard Iker Lecuona (Ducati) to ninth—the final points-scoring position.
With his ninth sprint race victory of the season, the reigning champion now has 365 points—10 more than Martín and 50 more than Italian rider Marco Bezzecchi (Aprilia), who finished fourth in the Australian race.
Jorge Martín has sustained a fracture to his radius...The Spaniard fractured his right radius following a crash during the Sprint race at the Australian Grand Prix, meaning he will be unable to compete in the final race of the MotoGP World Championship event at Phillip Island.
It is a massive blow for the Madrid-born rider, whose 2026 MotoGP title aspirations have been severely hampered after he injured his right wrist in a high-speed crash during the Phillip Island Sprint while battling for the win against Marc Márquez.
Martín, who arrived at the iconic Australian circuit as the overall championship leader, was putting on a masterclass in overtaking against his main title rival until, on the eighth of 13 laps, he lost control of his Aprilia RS-GP at high speed at Turn 8.
Alarm bells rang when the Spanish rider had to be carried away on a stretcher to the medical center, where initial X-rays revealed a fracture to his right radius, as well as a possible fracture to the distal end of his right ulna—rendering him unfit for tomorrow’s race in Australia, according to Aprilia.
Minutes later, Franco Perona, the team doctor for Aprilia, confirmed to DAZN that Martín will need to undergo a CT scan to determine the full extent of the injury, whether surgery is required, and, consequently, his expected recovery time.
by Autonews
sexta-feira, 23 de outubro de 2026
AUTONEWS
Even the website crashed: BMW offers €650,000 per employee for voluntary departures
German luxury automaker BMW—which leads its rivals Mercedes and Audi with 2.17 million vehicles sold—aims to boost its profit margin from the current 3% to 5%. To achieve this, the company has devised a strategy that focuses not on selling more cars or raising prices, but on reducing its workforce—offering severance packages that exceed the industry average to cut labor costs.
The German manufacturer’s goal is to have 8,000 fewer employees by the end of 2027. To this end, it has established a severance package worth over €650,000 per person. This amount could be even higher if an employee leaves the company by May 31 of next year, qualifying them for what the brand calls a "Turbo Bonus." For those who depart between that date and October 31, no additional bonus is offered; however, employees who reach the age of 55 by the end of October may be eligible for discounts on the brand's vehicles.
According to the German publication *Handelsblatt*, these proposals are more competitive than the average for the German automotive sector—surpassing Volkswagen, which offers an average of around €400,000, and even Mercedes, which offers €500,000. It is no surprise, then, that the response has been overwhelming: tens of thousands of employees attempted to access the dedicated online portal, causing the website to crash.
Naturally, the severance amount is calculated based on factors including the employee’s salary, age, and length of service with the company. BMW’s new CEO, 57-year-old Serbian Milan Nedeljkovic—who joined the German manufacturer in 1993 and previously oversaw the company’s production operations before succeeding Oliver Zipse in May 2026—expects to achieve 1 billion euros in savings starting in 2028, while also projecting profit margins of between 8% and 10% beyond 2030.
$730,000...Reported BMW severance offers vary by age, salary, and tenure, with early departures and flexible payment options shaping who leaves and when.
BMW's voluntary-exit portal went live in mid-October 2026. It was quickly overwhelmed after large numbers of employees logged in to check their severance offers.
According to German reporting, the company then temporarily paused new applications after strong interest in the program.
Some of those offers reportedly top €650,000 (about $730,000). BMW wants roughly 8,000 positions gone by the end of 2027, and the numbers on the table appear to be driving the rush.
BMW has given roughly 50,000 employees access to a portal where each worker can see an individualized severance number, according to Handelsblatt. That internal site reportedly struggled under a surge of traffic shortly after launch.
The German business daily reports that it obtained a confidential sample termination agreement detailing the offer structure and listed examples where payouts topped the headline figure.
The €650,000 figure is not a standard offer. It's the high end reported in individual cases described in the leaked document, and a BMW spokesperson declined to confirm the amount when asked.
Most eligible staff should expect something well below that ceiling.
The financial and fiscal situation of the BMW Group (Bayerische Motoren Werke AG) reflects the landscape of transformation and volatility currently facing the global automotive sector. Key highlights regarding the company’s financial health, profitability, and debt structure are as follows:
1. Profit Margins and Operational Performance: Decline in Automotive Margins: Operating margins (EBIT) for the automotive division have fallen from previous peaks, settling at more moderate levels. In recent quarters, the automotive division’s margin has ranged between 2% and 5%, impacted by weak global demand, rising operating expenses, and the transition toward electromobility.
Impact of Competition and Tariffs: Operating profit has faced pressure due to intense competition in the Chinese market—where local sales have seen unprecedented declines compared to the U.S. market—as well as rising costs for materials and global automotive tariffs.
Resilience through Cost Reduction: Management has been implementing rigorous initiatives to cut operating expenses and improve production efficiency in order to offset margin compression.
2. Balance sheet and debt structure:
-Total assets: The group’s balance sheet reports global assets of approximately €273 billion.
-Debt and liabilities: The group’s total liabilities stand at around €180 billion to €190 billion (approx. US$200 billion). Long-term debt reached €74 billion in recent quarters.
-Financial Services Segment (BMW Financial Services): It is worth noting that a significant portion of the group’s consolidated debt belongs to its financial services division, which is used to fund leasing operations and automotive credit for consumers and dealerships worldwide—a standard practice among major automakers.
3. Capital allocation and investment strategy:
-"Neue Klasse" projects: BMW continues to direct significant capital toward R&D (Research and Development) focused on its new electric architecture (Neue Klasse), next-generation batteries, and automotive software.
-Cash generation: Despite a challenging macroeconomic environment, the company maintains positive operating cash flow, supporting dividend payments and funding the energy transition without compromising short-term liquidity.
Employees get two windows to leave: March 31, 2027, or October 31, 2027. Those who commit to the earlier date reportedly qualify for an extra "Turbo Bonus" on top of their base payout, intended to thin the workforce faster.
Payment isn't one-size-fits-all, either. The program reportedly lets workers choose a lump sum, installments, contributions toward retirement savings, direct insurance payments, or some combination of those four.
The whole arrangement is set to expire on October 31, 2027, per the sample agreement in circulation.
BMW Severance Eligibility...The payout reportedly weighs a worker's salary, age, and years at the company. That's why headline figures near €650,000 apply mostly to long-tenured, higher-paid employees rather than the broader workforce getting these offers.
Age carries its own threshold. Employees who turn 55 by October 31, 2027, may qualify for benefits normally reserved for BMW retirees, adding another layer on top of whatever cash package they negotiate.
Some departing staff would reportedly keep certain BMW perks after leaving, including discounts on new and used vehicles. That detail softens the exit for employees who have spent decades buying into the brand.
The buyouts arrive as BMW pursues broader management-level cuts across the company, following the roughly 8,000 job reductions announced for completion by the end of 2027. Rivals have moved on similar timelines: Porsche has floated plans affecting 5,000 positions, while Jaguar Land Rover has run its own voluntary departure scheme.
BMW is offering severance packages of up to €650,000 (approximately US$ 730,000) in specific cases to encourage the voluntary departure of around 8,000 employees—primarily in administrative, planning, and development roles in Germany—by the end of 2027. This initiative aims to cut long-term fixed costs and restructure the company without resorting to forced layoffs.
Key drivers of the strategy:
• Market pressure and profit margins: BMW seeks to increase its operating profit margin in the automotive sector (from around 3% toward a 5% target) in the face of slowing demand in critical markets like China and intense competition from electric vehicle manufacturers.
• Efficiency and automation: With the arrival of new vehicle generations, increased use of artificial intelligence, and the need to streamline corporate hierarchies—including a 20% reduction in senior vice president positions and divisions—the company expects to save approximately €1 billion annually starting in 2028.
• Avoiding labor conflicts: Rather than implementing compulsory mass layoffs—which would face strong resistance from the works council and run up against Germany’s strict labor laws—BMW has negotiated a voluntary departure program.
How the €650,000 payment works:
• Not for everyone: The €650,000 cap applies only to rare, specific instances—involving highly senior employees with long tenures and higher salaries (with the amount calculated based on age, length of service, and total compensation).
• "Turbo Bonus": BMW included extra incentives for those who agreed to leave sooner, with scheduled departure dates (for example, March 31 or October 31, 2027).
• Additional benefits: The package may include lump-sum or installment payments, contributions to pension or insurance funds, letters of recommendation, and permanent discounts on the purchase of the brand’s vehicles (or the option to acquire one’s company car).
• Massive uptake: The proposal attracted so much interest that tens of thousands of employees signed up, overwhelming the company’s internal portal and forcing an early closure of the registration process.